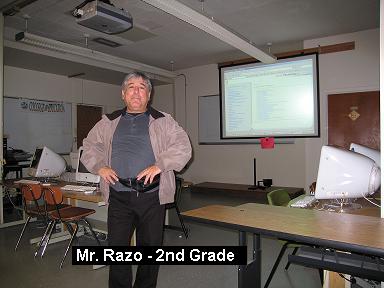
DATE: March 3, 2008
| Mr. Razo | Temperature | Room 6 |
|---|---|---|
 |
SUBJECT: – Science: Grade Two - Temperature
INSTRUCTIONAL GOAL: Students should be able to read the (analog and digital) temperature measurements in degrees Celsius provided by a standard thermometer.
California Content Standards - Science, 2nd Grade Investigation and Experimentation
|
|---|
PERFORMANCE OBJECTIVE: Students should be able to read the correct temperature indicated by the thermometer 100% of the time.
LESSON: Measuring temperature (from: Discovery Science Center - Education - Lesson Plans by Grade)
Materials:
Procedure:
- Set up 3 thermometers
- 1 in a bowl of ice
- 1 at room temperature
- 1 under a moderaately hot desk lamp
- Show students how to read temperature using a thermometer
- Record the temperature of each thermometer
- Plot these temperatures next to a large picture of a thermometer on the white board to see how temperature rises from cold to hot.
DETAILED INSTRUCTIONAL PROCEDURE
Focusing event (something to get the students' attention) |
Ask the students about really HOT, and COLD things (the sun, fire, stove, etc.) and COLD (ice, drinks, the Polar Regions, etc.) As available, show pictures of the Arctic , Antarctic, Desert, and Volcanic eruption heat, a freezer and a stove at home (PHYSICAL/VIRTUAL) |
|
Teaching procedures |
1.-
|
Focus on the large (PHYSICAL) thermometer manipulative in the front, and explain the REASON FOR USING setting up the glass container with the temperature-sensitive, liquid metal Mercury inside it. Explain WHY the change in height of the (thin) column of Mercury inside the vertical glass tube in the is due to its expansion (UP) due to heat, and contraction (DOWN), due to cold. Explain that most materials do likewise. As available, display/project the (VIRTUAL) simulation of a thermometer available at www.animath.net/thermometer.htm. This simulation focuses on showing a view of the most common temperature measuring scales: CELSIUS AND FAHRENHEIT. Explain that the numbers were a matter of practical choice by two different scientists. Refer to the important points in the scales, such as the freezing (0, 32) and boiling of water (100, 212), and the values for the temperatures for places where humans live. KEY questions: 1.- Which scale has more "tick marks" in it?
|
| 2.- | Now focus on the 3 thermometers previously setup in front of the class:
Ask different students to approach each one of the 3 thermometers, read and call the temperature value of each in both Celsius and Fahrenheit degrees. Write down all the possible different numbers given by the students on the board. At the end, request agreement from the class on a single value of temperature for each of the 3 thermometers. Taking orderly turns, allow the students to manipulate the virtual thermometer themselves (mouse) to any point of interest, including the temperatures seen in the 3 physical thermometers set up in class.
|
|
| 3.- | Use the 3 values of temperature obtained from the thermometers, to create a bar graph with an ordinal horizontal scale: COLD (ice bowl), ROOM TEMPERATURE, and HOT (under the lamp) . e.g.
Note: This graph can be created cooperatively, with a skeleton structure provided by the teacher on a large sheet of paper, and individual students providing the numbers and drawing each bar, one at a time.
|
|
Closure |
State the value of measuring temperature. Emphasize the fact that although the numbers are different in the Celsius and Fahrenheit scales of temperature, they both measure the same thing (many thousands of degrees)- degrees Fahrenheit are "smaller" that degrees Celsius since one (F) has 212, compared with only 100 for the other (C). Mention also that objects like the sun are indeed very hot, at times reaching thousands of degrees, and that regions far away from the sun into space (i.e. Neptune, Pluto), are very cold, possibly hundreds of degrees "below zero", or negative. Also, it can be mentioned that there is a "super cold" temperature (at around -273 Celsius degrees), when EVERYTHING FREEZES COMPLETELY, and that it is a a topic in Science lessons in later school years and very important in science in general. |
|
EVALUATION PROCEDURES